I see a lot of new job board owners who are not familiar with Google Analytics and the stats it tracks. But you need to understand the key metrics that make job boards work. So consider this a primer for what you need to know and keep up with on a monthly basis.
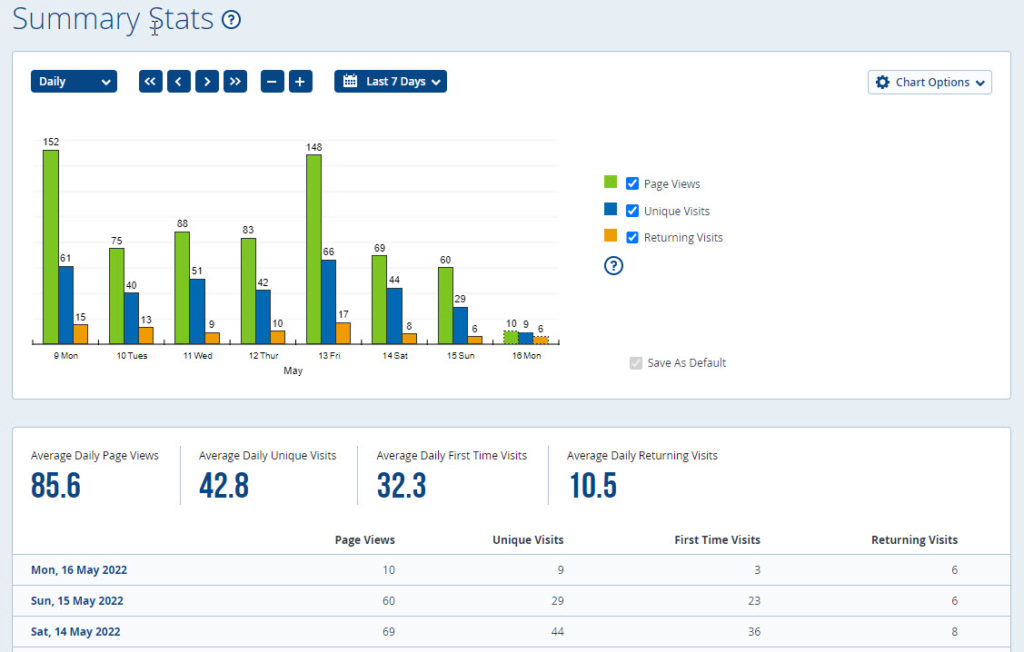
Google Analytics can be a complicated dashboard so I also backup those stats with a Statcounter account. They have a simpler dashboard and offer a look at the basics.

Google Analytics offers a much deeper look into your site. You need to understand where your traffic comes from. Take this pie chart for example. Navigate to Acquisition > Overview in the menu to see it.
Your pie chart should look something like this. Meaning you have traffic coming in from a variety of different channels. Good job boards diversify their traffic.
Other Key Stats
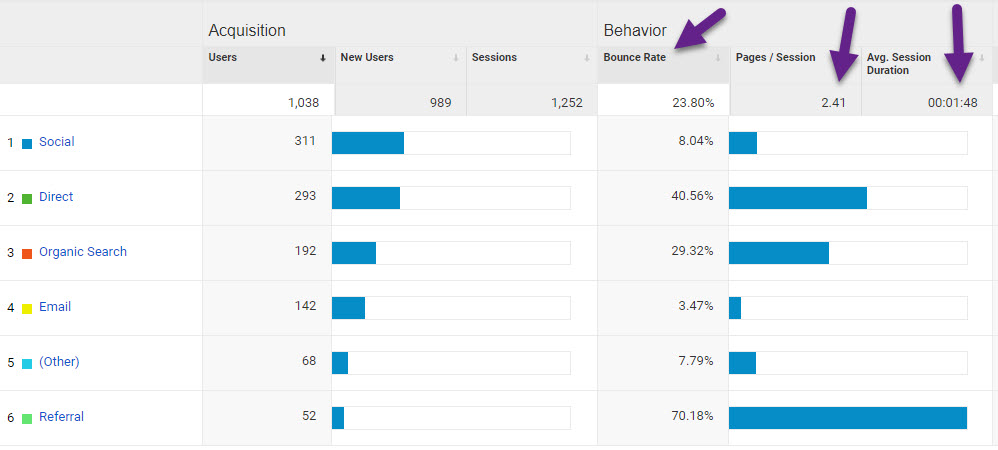
The major stats to really care about include bounce rates, pages per session, time on site. For things like referrals that keeps track of which sites are linking to you which is a key metric for increasing your SEO traffic. The more backlinks you have the better you will rank.
Bounce rate: this stat tells who how quickly people are leaving your site. if your bounce rate is higher than 50% that’s not a good sign. You are losing people as soon as they click over. In the image below for my HR job board, the bounce rate is only 23%. I’m doing a pretty good job at keeping my traffic,
Pages/Session: My visitors click on an average of 2.41 pages as they click through the site. I’d prefer that be at least 3 pages per session to show more usage.
Session Duration: Most job boards should have a session duration of at least 3 to 5 minutes so I could be doing a better job at this. But with most job listings having a redirect to apply this could be the reason why this is lower.


